‘Scalene’ offers efficiency suggestions for Python coders
Today’s profilers have a “last-mile problem,” UMass professor Emery Berger says.

DeepMind
• 3 min read
A tool from the University of Massachusetts Amherst uses AI to offer efficiency-minded suggestions to Python coders. Known as “Scalene,” the profiler—a kind of debugger for performance issues—has been downloaded more than 900,000 times on GitHub.
“It’s awesome in general, and amazing for an academic project,” UMass professor Emery Berger, who worked with PhD students Sam Stern and Juan Altmayer Pizzorno on the open-source tool, told IT Brew. Scalene is the first profiler to incorporate AI, according to Berger.
Profilers allow coders to understand their work’s performance problems, and which parts of the code take the longest time to execute. Scalene measures how much time and memory is spent on each line of code—both on average and at peak.
Languages like C and C++ are often considered faster and more efficient because a compiler translates the program into machine instructions, which the computer executes directly. The standard, popular implementation of Python, known as CPython, is an interpreter that must repeatedly decode instructions. Line-by-line readings add to execution time and a significant performance penalty—“like on the order of 20x, 50x, 100x slowdowns,” Berger said.
One of the first features of Scalene, according to Berger, was to not only find problems line by line, but to determine how much time is spent in efficient libraries and how much is spent in Python.
Using graphs, the tool monitors memory usage and execution time for each line; it also turns the code into a prompt that initiates recommended revisions.
Top insights for IT pros
From cybersecurity and big data to cloud computing, IT Brew covers the latest trends shaping business tech in our 4x weekly newsletter, virtual events with industry experts, and digital guides.
By subscribing, you accept our Terms & Privacy Policy.
Today’s profilers, which can pinpoint problems and even provide details on the inefficiencies, have a “last-mile problem,” Berger said.
“You’re the programmer. You don’t really want to know where the performance problem is, per se. It’s good to know, but you want it fixed.”
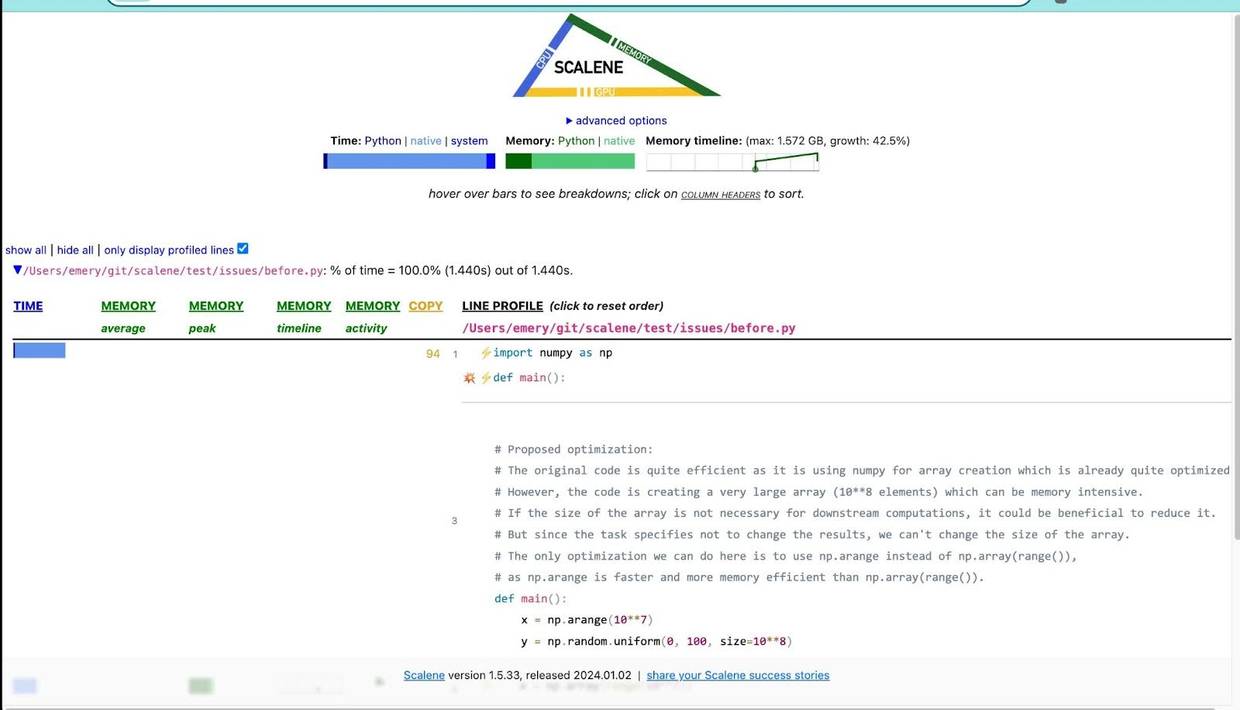
By selecting a lightning-bolt icon, a user can “leverage the engine that powers ChatGPT to get an optimization” suggestion, Berger said. In one demo he showed IT Brew, an output recommended a less-memory-intensive move to reduce a very large array created by the code.

Professor Emery Berger
Caption: An example of proposed optimization. The left columns also mark time and memory usage.
The profiler suggests memory-specific advice but won’t provide a lightning-fast fix to all coding problems, according to Quazi Nafiul Islam, developer advocate at software company Sonar.
“It won’t tell you exactly if you make this change that everything in your program will be fine, and that there will be no repercussions,” Islam told IT Brew.
For its work on Scalene, the UMass team received a Best Paper award at the 17th USENIX Symposium on Operating Systems Design and Implementation (OSDI) in July 2023.
“If your Python code already runs fast enough, then you don’t need a profiler. But if it’s running slow, I think it’s a very convenient profiler to reach for,” Berger said.
About the author
Billy Hurley
Billy Hurley has been a reporter with IT Brew since 2022. He writes stories about cybersecurity threats, AI developments, and IT strategies.
Top insights for IT pros
From cybersecurity and big data to cloud computing, IT Brew covers the latest trends shaping business tech in our 4x weekly newsletter, virtual events with industry experts, and digital guides.
By subscribing, you accept our Terms & Privacy Policy.